In today’s Agile development world, tracking progress is essential. The agile burndown chart template is here to help. It’s a tool that boosts sprint planning for project managers, Agile teams, and Scrum masters.
These templates are vital. They range from simple to complex, like release and risk burndown charts. They show team progress and tasks left, making sprints better.
The templates show our overall work and when we might finish. They help us set goals for future sprints by looking at our current work.
For more information on burndown charts, check out these customizable templates.
Key Takeaways
- Agile burndown chart templates are indispensable for effective sprint planning.
- They offer real-time visualization of team progress and remaining tasks.
- Customizable templates cater to varied Agile project requirements, from simple to complex tracking needs.
- Burndown charts serve as predictive tools for future sprint planning by analyzing current progress.
- Integrating these charts into Agile methodologies facilitates improved team productivity and task management.
Introduction to Agile Burndown Charts
Agile Burndown Charts are crucial for managing projects. They show how fast tasks are completed against what’s left in a sprint. They’re great for seeing work visualization. This shows sprint progress and helps teams hit their targets on time.
Using a good Agile Burndown Chart Template is key. It lets project leaders and Scrum masters predict efforts needed for future releases. This makes sure we meet goals and satisfy clients. There are three types: sprint, release, and product charts. Each plays a unique role in managing projects.
Sprint burndown charts usually run for 1-4 weeks. They help teams see daily progress and check if they’re on track. Release burndown charts overview the progress of multiple sprints in a single release. They show how close we are to finishing user stories and epics.
Product burndown charts give a long-term view of the product backlog. They’re essential for making big decisions.
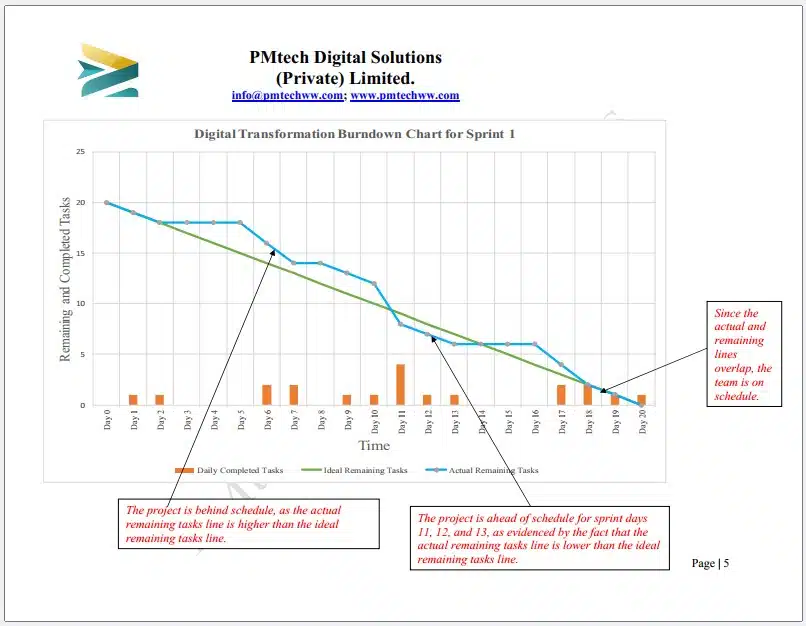
Burndown charts are about knowing the axes: the X-axis for time and the Y-axis for work left. Actual effort lines show progress per sprint or day, which can change for many reasons. Ideal effort lines show how work should progress in a perfect world.
Burndown charts are super useful for Agile teams in short sprints. They show what’s done, what’s left, and how much time is left. These charts help keep project updates fresh. They also spotlight issues before they get worse. We mainly see two types: the sprint burndown for work in each iteration, and the product burndown for the whole project’s work.
Keeping the Agile Burndown Chart Template up to date keeps teams on their toes. These charts not only show the current state. They also point out which tasks might not finish on time. This focus on upcoming risks ensures projects are managed well and finished successfully.
Key Features of an Agile Burndown Chart Template
An Agile burndown chart is a key tool in Agile development. It offers several features to help with task estimation and project tracking. It allows for real-time views of progress, giving updates on work left to do.
Task Tracking Capabilities
Task tracking is essential in project management, and an Agile burndown chart is vital for this. Teams can list tasks, categorize features, and note initial estimates. This lets team members keep an eye on work versus actual progress.
Project and product managers find burndown charts useful for tracking sprints. They help spot problems early and keep projects on track. Teams that regularly update and track their goals are more likely to meet them. Daily updates on burndown charts help manage unexpected changes and ensure tasks finish on time.
Customizable Options
Agile burndown charts offer customizable features. Teams can tailor charts to their needs. This includes changing time frames, altering effort graphs, and applying color codes for different statuses.
- Adjust time periods to fit specific sprint durations.
- Use color-coded indicators to highlight task statuses.
- Modify effort graphs to better represent team estimations.
Using a customizable Agile burndown chart can improve project management. It helps in setting clear goals, tracking progress, and celebrating achievements. This boosts the team’s morale and encourages a productive work environment.
Using Burndown Charts for Effective Sprint Planning
Agile burndown charts are key for Sprint Planning in Agile Development. They show work done and what’s left, offering a clear view. They also predict how a project will go, measuring progress during specific times. This helps manage sprints well in Scrum Methodology.
In stand-up meetings, these charts help check off completed tasks. They are simple and easy for all team members to get. They show progress and any differences, helping teams meet deadlines and budgets.
We often use tools like Jira for up-to-date burndown reports in Sprint Planning. It helps us spot and fix issues early, keeping the project on track.
Burndown charts track work done and highlight pending tasks. They give a peek at each sprint’s work and what’s left. Updating these charts daily keeps everyone aware and accountable. Agile Development values this clear communication for managing work and setting fair goals.
| Feature | Benefit | Function in Scrum |
|---|---|---|
| Visual Progress Tracking | Clear snapshot of work done vs. work needed | Helps in sprint evaluations and adjustments |
| Forecasting Tool | Predicts work completion timelines | Aids in planning future sprints efficiently |
| Daily Updates | Ensures real-time tracking of progress | Promotes consistent work pace and teams’ accountability |
We improve our burndown chart estimates using past data on team speed. Tools like Miro’s chart template adapt to different sprint lengths. This flexibility meets varied project needs.
Adding these methods to our Sprint Planning shows the real spirit of Agile Development and Scrum Methodology. It keeps teams ahead, open, and in control. This way, they smoothly move through sprints, aiming to reach project targets.
Advantages of Implementing Burndown Charts in Scrum Methodology
Using Burndown Charts in Scrum Methodology brings big benefits. They allow for tracking a project in real time and estimating tasks efficiently. These charts make the team’s progress clear, aiding in smart decision-making. Adjustments can be made as needed.
Enhanced Project Tracking
Burndown Charts are great for tracking projects fully. They show work left against time left. This way, teams see how they are doing fast. The quantity of story points a team completes informs how quickly they work.
For example, if a team finishes 30 story points and has 155 left, they need about six sprints to clear the backlog. This clear view helps everyone work together well. It makes sure all are working towards the same project aims.
Efficient Task Estimation
A big plus is better task estimation. Teams use past data to plan sprints smarter with Burndown Charts. By seeing planned against done tasks, they get better at predicting future work. Even when things don’t follow the perfect path, 72% of sprints still meet goals. This shows how valuable Burndown Charts are in Agile Development. They help set real goals and boost efficiency.
When paired with other tools, Burndown Charts get even stronger. Teams can look into their performance, see how the project moves along, plan budgets, and handle issues like too much work or guessing wrong. Burndown charts create a space for ongoing improvement and clear talks. They’re vital for anyone using Scrum Methodology.
How to Integrate Burndown Charts with Kanban Boards
Using an Agile Burndown Chart Template with Kanban Boards gives a full view of your team’s work. This mix improves the whole Agile Development process. Kanban boards show work flow well. Burndown charts track sprint progress closely.
Kanban boards show what’s being done with columns like “To Do,” “In Progress,” and “Completed.” This pairs well with the detailed progress an Agile Burndown Chart Template shows. Together, they offer both broad and detailed views of work. This helps teams make smart choices and quick changes.
Mixing these tools has a big plus. Burndown charts can spot issues faster than old ways. For example, if work finishes early, the burndown chart calculates the new finish date. It can also factor in non-work days.
Jira software is often the top choice for combining these tools. It lets teams set goals and track both short- and long-term projects. With daily chart updates, teams can see how they’re doing right away. This helps find and fix hold-ups fast.
Bringing burndown charts and Kanban boards together is great for software teams. It blends visual tasks with detailed tracking. This lets teams guess when they’ll finish work, share out tasks better, and stay on target. So, mixing these tools raises productivity and makes projects run smoother.
Best Practices for Using Agile Burndown Chart Templates
To get the most out of an Agile Burndown Chart Template, follow best practices. Keeping project tracking current is crucial. Reviewing team performance after sprints also enhances future work.
Regular Updates and Monitoring
Keep the Agile Burndown Chart Template fresh to see progress clearly. Project tracking becomes more effective this way. It also spots early issues and boosts team efficiency.
Users often miss features like burndown charts in their Agile tools. Such charts are key for tracking progress and understanding team metrics. They show if the team is behind or managing their daily tasks well.
Cumulative flow diagrams show how work moves through stages and finds hold-ups. Using Jira Software can help manage these charts better. It offers advanced tracking methods.
Conducting Sprint Retrospectives
At each sprint’s end, review the Sprint Retrospective. It’s vital for Agile Development. This examines the effort difference and boosts performance knowledge.
Teams look at burndown charts to get detailed project info. These charts have time on one axis and remaining work on the other. Such details are essential for evaluating a sprint’s success.
Applying these practices makes Agile Burndown Chart Templates more impactful. Updates and detailed sprint reviews refine project understanding. This sharpens resource and task planning.
Conclusion
Using an Agile Burndown Chart Template boosts our sprint planning and Agile development. It offers real-time insights and keeps projects on track. The visual comparison of finished tasks against what’s left motivates the team. It keeps everyone focused on project goals.
Adding them to Agile tools like Kanban boards increases their value. Creating charts with traditional tools such as Excel can be tough and prone to mistakes. By using platforms like Nifty or PMtech Digital Solutions, we make project management smoother and more cooperative. These sites offer better features than Excel. This includes improved data insights and real-time updates, which are key for accurate planning.
Adopting best practices ensures our teams do more than just hit their targets. Regular updates, monitoring, and detailed sprint retrospectives push our methods forward. They also secure project success and growth. The Agile Burndown Chart Template is essential, enhancing efficiency, openness, and teamwork in every sprint.


