

Gantt charts are powerful tools for project scheduling and task visualization. As a visual project management tool, Gantt Chart guide provide a clear visual of a project’s timeline. This makes managing tasks, allocating resources, and tracking progress easier.
Understanding Gantt charts can improve your project planning and execution. They’re useful for both experienced project managers and beginners.
This guide explores Gantt charts, their history, components, and practical applications. We’ll look at real-world examples from various industries. These include construction, manufacturing, IT, and marketing.
We’ll cover critical path method, dependency mapping, and progress monitoring. You’ll learn how to use Gantt charts for timeline management and milestone tracking.
We’ll showcase the best Gantt chart examples and templates. These will inspire your project planning efforts. Let’s explore how Gantt charts can revolutionize your project management approach!
Key Takeaways!
- Gantt charts are essential tools for project scheduling and task visualization
- They help in timeline management, milestone tracking, and resource allocation
- Gantt charts are used in various industries, from construction to IT
- Understanding the critical path method and dependency mapping is crucial
- Real-world Gantt chart examples and templates can inspire your project planning
What is a Gantt Chart?
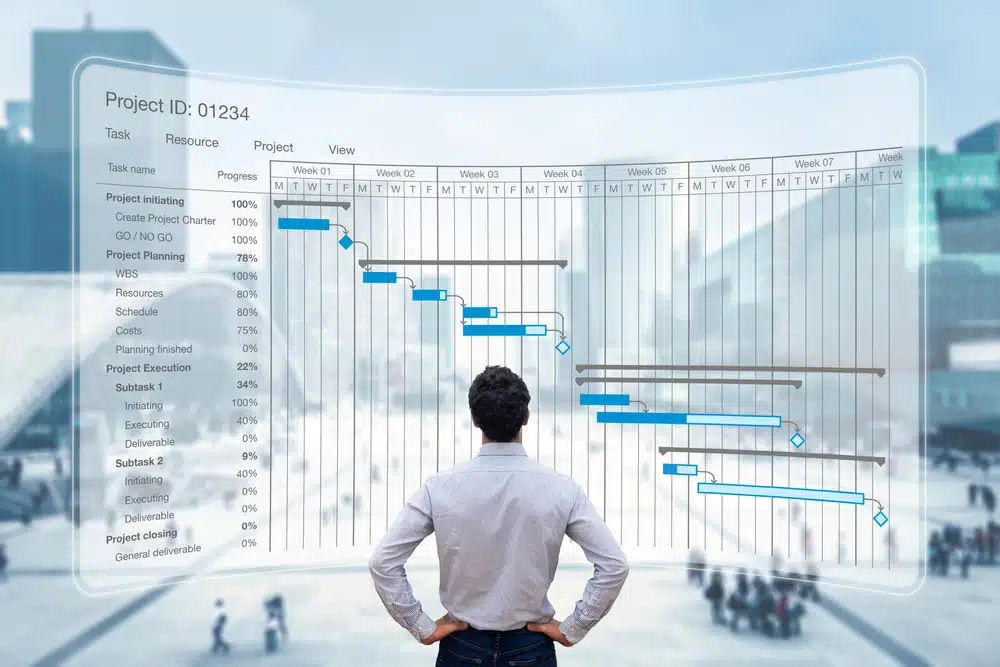
A Gantt chart visually represents a project’s schedule using a horizontal bar chart. It shows task order, due dates, and duration through Gantt chart bars, which represent tasks and their durations on a timeline. Gantt charts help project managers communicate status and keep projects on track.
These charts are widely used across various industries. They break projects into manageable chunks with start and end dates. This helps teams meet milestones efficiently.

Definition of a Gantt Chart
A Gantt chart is a visual display of tasks against time. It shows start and finish dates of project elements and milestones. Project managers using the waterfall model often prefer Gantt charts.
Key Components of a Gantt Chart
Understanding key Gantt chart components within a project management chart is crucial for effective use. These elements help organize and track project progress.
- Task list: A vertical list of project tasks on the left side of the chart
- Task bars: Horizontal bars representing the duration of each task
- Milestones: Key dates or achievements within the project timeline
- Dependencies: Lines or arrows connecting tasks to show the required sequence
- Timeline: A calendar or time scale at the top of the chart for plotting tasks and milestones
Creating a Gantt chart requires essential information like task lists and start dates. It also includes task dependencies, owners, and allocated team members.
Modern Gantt chart tools like Jira offer advanced features. These include collapsible task structures and resource management panels. Such tools cater to software development and other industries.
| Gantt Chart Component | Description |
|---|---|
| Task List | A vertical list of project tasks on the left side of the chart |
| Task Bars | Horizontal bars representing the duration of each task |
| Milestones | Key dates or achievements within the project timeline |
| Dependencies | Lines or arrows connecting tasks to show the required sequence |
| Timeline | A calendar or time scale at the top of the chart for plotting tasks and milestones |
The History & Evolution of Gantt Charts by Henry Gantt
Gantt charts emerged in the early 20th century during rapid industrialization. Henry Gantt, an American engineer, developed this tool for better project planning and tracking. His invention transformed project management practices worldwide.
Karol Adamiecki, a Polish engineer, designed a similar diagram called harmonogram in 1896. However, he published only in Polish and Russian, limiting its reach. Gantt popularized the chart in English-speaking countries between 1910 and 1915.

Gantt charts have evolved from simple, hand-drawn diagrams to sophisticated digital tools. Modern software offers enhanced flexibility and ease of use. These charts have become indispensable for project managers across industries.
“The Gantt chart is one of the most widely used management tools for project scheduling and control.” – Project Management Institute“
Today, Gantt charts are used in various project management applications. These include resource allocation, task dependencies analysis, and progress tracking. They also help with team collaboration and budget control.
- Resource allocation and management
- Task dependencies and critical path analysis
- Progress tracking and performance monitoring
- Team collaboration and communication
- Budget and cost control
Gantt charts continue to adapt to meet changing business needs. They’ve grown from simple timelines to powerful, multi-faceted tools. These charts remain essential in every project manager’s toolkit.
The Purpose of Gantt Charts in Project Management
Managing projects with Gantt charts is vital. They help plan, schedule, and track projects effectively. Over 1 million users rely on free online Gantt charts, showing their widespread popularity.
These charts boost productivity by up to 32%. They also improve resource allocation and team collaboration. Project managers can achieve better results with Gantt charts.

Planning & Scheduling Projects
Gantt charts excel at project scheduling. They map out project phases with clear start and end dates, enabling a project manager to efficiently manage timelines and task dependencies. This visual tool helps identify milestones and deadlines.
Teams can set realistic expectations with 76% accuracy. Gantt charts also help manage resources and costs. They improve collaboration between team members.
Tracking Project Progress
Project managers can track progress and milestones easily with Gantt charts. They provide a clear overview of the project timeline. This helps identify potential delays or issues quickly.
57% of project leaders use Gantt charts for better task tracking. These tools are crucial for monitoring progress and ensuring successful completion.
| Benefit | Percentage |
|---|---|
| Increased productivity | 32% |
| Improved task tracking | 57% |
| Enhanced project overview for stakeholders | 68% |
| Accurate deadline setting | 76% |
| Increased task execution efficiency | 88% |
Identifying Task Dependencies
Gantt charts show task dependencies clearly. This ensures tasks start only after previous ones are done. It helps avoid delays and optimizes project efficiency.
These charts aid in resource allocation and work scheduling. They benefit 43% of projects. Gantt charts simplify complex information and reduce overwhelm.
“Gantt charts are a game-changer for project management. They provide a clear roadmap, keep everyone on the same page, and help us deliver projects on time and within budget.”
Gantt charts are powerful project management tools. They help with planning, scheduling, and tracking progress. Project managers can boost productivity and ensure successful project completion with Gantt charts.
Benefits of Using Gantt Charts in Project Management
Gantt charts are a powerful project management tool that offers numerous benefits to project managers and teams. Here are some of the key advantages of using Gantt charts in project management:
Improved Project Visibility
Gantt charts provide a clear and concise visual representation of the project schedule, making it easier for project managers and team members to understand the project timeline and dependencies. This improved visibility enables teams to identify potential issues and make informed decisions to ensure the project stays on track. By visualizing the entire project at a glance, project managers can quickly assess progress and adjust plans as necessary to meet deadlines.
Enhanced Collaboration
Gantt charts facilitate collaboration among team members by providing a shared understanding of the project schedule and dependencies. This enables teams to work together more effectively, identify potential roadblocks, and make adjustments to the project plan as needed. When everyone is on the same page, communication improves, and the likelihood of project success increases. Gantt charts serve as a central reference point, ensuring that all team members are aware of their responsibilities and deadlines.
Better Resource Allocation
Gantt charts help project managers allocate resources more effectively by providing a clear view of the project schedule and dependencies. This enables teams to identify potential resource conflicts and make adjustments to the project plan to ensure that resources are allocated efficiently. By visualizing resource allocation, project managers can prevent overallocation or underutilization of team members, leading to a more balanced and productive workflow.
When to Use a Gantt Chart?
Gantt charts are essential tools for project planning and monitoring. They help develop project schedules by showing tasks, durations, and dependencies visually. This visual representation allows for better activity sequencing and resource allocation.
These charts track progress and identify potential issues as projects move forward. They serve as a central reference for the entire team. Regular review meetings compare actual progress to the original plan using Gantt charts.
Gantt charts keep stakeholders, clients, and executives informed and engaged. They provide a high-level overview of the entire project. This visual clarity instills confidence and aids in decision-making.
“Gantt charts are not just for project managers. They are a valuable tool for keeping stakeholders, clients, and executives informed and engaged. The professional, easy-to-understand visuals offer a high-level overview of the entire project, instilling confidence and facilitating decision-making.”
Gantt charts excel in certain project situations:
- Projects with multiple tasks and dependencies
- Projects requiring resource allocation and scheduling
- Projects with specific start and end dates
- Projects that benefit from visual progress tracking
However, Gantt charts may not suit all projects. They might be premature during early project stages when details are unclear. For projects with changing requirements, a more agile approach may work better.
| Project Phase | Gantt Chart Usage |
|---|---|
| Initiation | Limited, as project scope and objectives are still being defined |
| Planning | Extensive, to develop a detailed project schedule and allocate resources |
| Execution | Regular, to monitor progress, track milestones, and identify issues |
| Monitoring & Controlling | Frequent, to compare actual progress to the plan and make necessary adjustments |
| Closing | Final review, to assess project performance and capture lessons learned |
Using Gantt charts effectively enhances project planning and scheduling. It optimizes monitoring throughout the project lifecycle. This visual tool empowers teams to deliver successful projects consistently.
How Gantt Charts Work?
Gantt charts help us manage complex projects. They have two main parts: a grid and a timeline. The grid lists tasks and details, while the timeline shows the project schedule.

The grid is the chart’s foundation. It contains task information like name, duration, dates, and resources. This data creates a timeline, giving an overview of the project’s progress.
Understanding the Gantt Chart Grid
The grid breaks down projects into smaller tasks. Modern Gantt software tracks various project aspects. These include task priority, phases, and work breakdown structure.
- Task priority
- Project phases
- Work breakdown structure
- Milestones
- Resource requirements
- Estimated and actual costs
Inputting this information creates a solid base for the timeline. It ensures all task details are accurate and easy to access.
Navigating the Gantt Chart Timeline
The timeline is a stacked bar chart showing task duration and sequence. Each task appears as a horizontal bar. The bar’s length indicates how long the task takes.
The timeline also shows important information like due dates and task dependencies. It displays percent complete and critical path activities too.
- Due dates
- Task dependencies
- Percent complete
- Critical path activities
The timeline helps identify bottlenecks and assess delay impacts. It allows for informed decisions to keep projects on track. Team members can easily understand progress and spot areas needing attention.
| Gantt Chart Component | Purpose |
|---|---|
| Grid | Lists tasks and relevant details |
| Timeline | Visually represents the project schedule |
| Task Bars | Indicates task duration and sequence |
| Dependencies | Shows relationships between tasks |
| Milestones | Marks significant project events |
| Critical Path | Highlights tasks that directly impact project completion |
Understanding how the grid and timeline work together is crucial. It allows for effective planning, execution, and monitoring of projects. This ensures high-quality results delivered on time and within budget.
Gantt Chart Examples for Various Industries
Gantt charts boost efficiency across industries. They help visualize project timelines and allocate resources effectively. These tools keep teams on track in construction, manufacturing, and IT.
Let’s explore how different sectors use Gantt charts. We’ll look at real-world examples to see their practical applications.
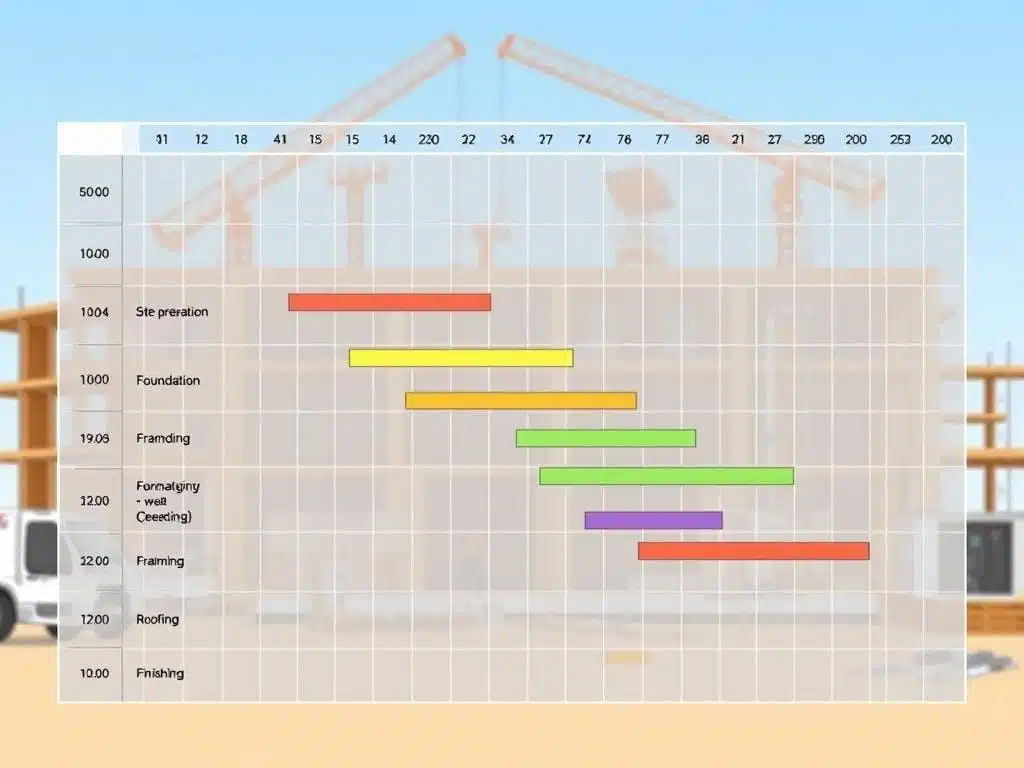
Construction Gantt Chart Example
Construction projects rely heavily on Gantt charts. They keep schedules tight and improve communication. A typical chart covers six main project phases.
- Contracts
- Design
- Procurement
- Construction
- Post-construction
- Closing
Each phase assigns tasks to team members. Dependencies are clearly defined, and milestones are set. This ensures the project stays on track.
Gantt charts help managers allocate resources efficiently. They speed up construction and prevent delays. Critical paths are identified to keep everything moving smoothly.
Manufacturing Gantt Chart Example
Manufacturing uses Gantt charts to map out production processes. They help create new products and establish production schedules. A typical chart might include these phases:
- Product ideation
- Design
- Prototyping
- Pre-production
- Production
These charts coordinate efforts across multiple teams. They ensure tasks are executed in a logical sequence. This minimizes confusion about dependencies and keeps production running smoothly.
IT Project Gantt Chart Example
IT and software development rely on Gantt charts. They manage complex projects with many moving parts. An IT project chart might include:
- Requirements gathering
- Design
- Development
- Testing
- Deployment
These charts assign tasks to team members. They visualize the sequence of events clearly. This helps managers spot potential bottlenecks and allocate resources efficiently.
IT project Gantt charts improve communication within teams. They foster collaboration and accountability. This leads to more successful project outcomes.
“Gantt charts are powerful tools for any industry. They provide clear visual representations of project timelines. These charts help teams stay organized and communicate effectively.”
What is Gantt Chart Used For?
Gantt charts are vital tools in project management, mainly for scheduling. They break projects into smaller tasks with set dates. This visual aid helps managers spot delays and adjust plans quickly.
These charts show task dependencies clearly. They reveal how tasks connect and must be done. This helps managers find the critical path and use resources wisely.

Gantt charts boost communication in projects. Tools like MS Project let you share plans easily. They provide a clear view of the project for all involved.
These charts work well in many fields. Construction, manufacturing, and software development all benefit. They’re great for projects with clear, step-by-step tasks.
| Gantt Chart Element | Purpose |
|---|---|
| Project List | Defines the tasks and subtasks of the project |
| Duration | Specifies the time required for each task |
| Milestones | Marks significant points or achievements in the project |
| Dependencies | Shows the relationships and order of tasks |
| Resource Allocation | Assigns resources to specific tasks |
Updating Gantt charts often helps catch issues early. This keeps projects on track and within budget. It’s a smart way to ensure successful project completion.
How Are Gantt Charts Used in Project Management?
Gantt charts are versatile tools used in various project management methods. They provide visual representations of project timelines, task dependencies, and resource allocation. These charts help managers plan, execute, and monitor projects more efficiently.

Gantt Charts in Waterfall Planning
Waterfall planning divides projects into sequential phases. Gantt charts help visualize these phases, ensuring projects stay on track. They also aid in appropriate resource allocation.
Project managers use Gantt charts to spot potential bottlenecks. This allows them to make adjustments and keep the project moving forward.
Gantt Charts in Critical Path Method (CPM)
CPM focuses on identifying the critical path in project management. This path is the longest sequence of dependent tasks determining project duration.
Gantt charts are crucial in CPM. They help managers identify and prioritize critical tasks. This ensures effective resource allocation and keeps projects on schedule.
Gantt Charts in Agile Planning
Agile project management emphasizes flexibility. However, Gantt charts still provide valuable high-level project timeline overviews. They visualize milestones, sprint durations, and task dependencies in Agile planning.
Teams use these charts to understand project scope better. They also help identify potential challenges during development. Gantt charts balance flexibility and structure in Agile methodologies.
“According to Project Management report, 50% of organizations “mostly or always” establish a baseline for their project schedules, highlighting the importance of effective project planning and tracking.”
Gantt charts are powerful tools for visualizing project elements. They help allocate resources and monitor progress in all project management methods.
These charts provide valuable insights for project managers. They enable informed decisions and better team communication. Ultimately, Gantt charts contribute to successful project delivery.
Who Uses a Gantt Chart?
Gantt charts are versatile tools used by professionals across various industries. They help plan, schedule, and track projects effectively. Project managers rely on these visual aids to break down complex projects into manageable tasks.
With Gantt charts, project managers can assign resources and monitor progress. This ensures projects are completed on time, within budget, and meet quality standards.
Team members benefit from Gantt charts too. They provide a clear view of tasks, deadlines, and each person’s role. This transparency fosters collaboration and accountability within the team.
Stakeholders and clients use Gantt charts to get project overviews. They can see timelines, milestones, and progress. This allows them to stay informed and provide feedback when needed.
Gantt charts are widely used in various industries, including:
- Construction: Contractors, building firm sponsors, engineers, homeowners, and government agencies use Gantt charts to negotiate tasks, manage resources, and plan layouts.
- Information Technology (IT): IT professionals use Gantt charts to plan and manage software development projects, system applications, and research history displays.
- Marketing: Marketing managers use Gantt charts to plan both online and offline activities and navigate unexpected changes.
- Banking and Finance: Managers in this sector use Gantt charts to establish effective contact centers for VIP clients and manage financial services.
Some of the roles that commonly use Gantt charts include:
| Role | How They Use Gantt Charts |
|---|---|
| Chief Executive Officers | To oversee and manage high-level projects and initiatives |
| General Managers | To plan and coordinate projects across multiple departments |
| Construction Project Managers | To plan and manage construction projects, ensuring timely completion and resource allocation |
| Operations Managers | To streamline processes and manage projects related to production and logistics |
| Marketing Managers | To plan and execute marketing campaigns and product launches |
| Consulting/Finance Managers | To manage client projects and ensure timely delivery of services |
| Event Planning Managers | To plan and coordinate events, managing timelines and resources |
| Customer Service Managers | To plan and manage customer support initiatives and projects |
| Remote Product Development Managers | To coordinate and manage remote teams working on product development projects |
| Military Officers | To plan and execute military operations and missions |
| Public Infrastructure Managers | To plan and manage public infrastructure projects, such as roads, bridges, and utilities |
“Gantt charts are the Swiss Army knife of project management, providing a versatile and effective tool for professionals across a wide range of industries and roles.”
Gantt charts are essential for successful project management. They help professionals plan, execute, and complete projects efficiently. These tools are valuable across many industries and roles.

How to Use a Gantt Chart
Gantt charts help organize, plan, and track projects. They break down tasks, create timelines, and identify dependencies. This tool ensures projects stay on track and meet goals.
Effective use involves key steps. These include task breakdown, resource allocation, and progress monitoring. Let’s explore how to harness the power of Gantt charts.
Create a Work Breakdown Structure
Start by creating a work breakdown structure (WBS). This divides your project into smaller, manageable tasks and subtasks. A well-structured WBS forms the foundation for your Gantt chart.
It helps you understand the project’s scope. You can ensure no important tasks are overlooked. This step is crucial for creating a comprehensive task list.
Create a Task List & a Gantt Chart Timeline
Next, create a detailed task list. Include start and end dates, durations, and assigned team members. This information will be used to build your Gantt chart timeline.
The timeline visually represents your project schedule. It shows how tasks spread over time. This view helps identify potential conflicts or overlaps.
Identify Task Dependencies
Consider task dependencies when creating your Gantt chart. Some tasks may rely on others before they can begin. Others might run in parallel.
Identifying dependencies ensures tasks are completed in the right order. This step helps create a more accurate and realistic project timeline.
Find the Critical Path of Your Project
The critical path is the longest sequence of dependent tasks. It represents the minimum time needed to complete the project. Identifying it helps prioritize resources and focus efforts.
This knowledge allows for more effective project management. It ensures you meet deadlines and manage the timeline efficiently.
Track Gantt Chart Milestones
Milestones mark significant progress in your project. Tracking them on your Gantt chart helps monitor overall progress. They serve as checkpoints for meeting important targets.
Milestones also aid in stakeholder communication. They keep everyone informed about the project’s current status and achievements.
Allocate, Schedule & Track Resources
Resource allocation is key in Gantt chart usage. Assign tasks to team members and track their workload. This ensures efficient and effective use of resources.
Gantt charts help visualize resource availability. You can make adjustments as needed to optimize project performance.
“According to recent studies, over 2,400 hours of usability testing have been completed on Gantt chart software, highlighting the importance of resource allocation and tracking in project management.”
Create Project Baselines & Compare Planned vs. Actual Results
Set project baselines at key points. This allows you to compare planned progress with actual results. Track variances and make data-driven decisions to keep your project on track.
Baselines help identify areas of delay or acceleration. You can then make necessary adjustments to maintain project momentum.
| Step | Description |
|---|---|
| Create a Work Breakdown Structure | Divide the project into manageable tasks and subtasks |
| Create a Task List and a Gantt Chart Timeline | List tasks with start and end dates, durations, and assigned team members; create a visual timeline |
| Identify Task Dependencies | Determine which tasks rely on others and ensure they are completed in the necessary order |
| Find the Critical Path of Your Project | Identify the longest sequence of dependent tasks to prioritize resources and manage the timeline |
| Track Gantt Chart Milestones | Monitor key events or deliverables to track progress and communicate with stakeholders |
| Allocate, Schedule and Track Resources | Assign tasks to team members, track workload, and optimize resource usage |
| Create Project Baselines and Compare Planned vs. Actual Results | Set baselines to compare planned progress with actual results and make informed decisions |
Creating a Gantt Chart
Gantt charts are vital for project management. They show tasks, timelines, and dependencies visually. This helps teams stay organized and on track.
We’ll explore how to make a Gantt chart. We’ll also discuss software and online tools that make the process easier.
Steps to Build a Gantt Chart
To create a Gantt chart, follow these essential steps:
- Define the project scope and break it down into manageable tasks.
- Determine the duration of each task and identify any dependencies between them.
- Create a timeline for the project and assign tasks to team members.
- Add milestones to mark significant achievements and adjust the schedule as needed.
Consider the relationships between tasks when building Gantt charts. Common relationships include:
- Finish to Start (FS): The most common relationship, where one task must finish before the next can start.
- Start to Start (SS): Two tasks can begin simultaneously.
- Start to Finish (SF): A task cannot finish until another task starts.
- Finish to Finish (FF): Two tasks must finish at the same time.
Estimating task duration is crucial for Gantt charts. This involves considering resources like labor, materials, and equipment.
Several estimation techniques can be used:
| Technique | Description |
|---|---|
| Analogous | Using historical data from similar projects to estimate durations. |
| Parametric | Applying standard rates or formulas to calculate durations based on specific parameters. |
| Three-Point | Considering the best-case, worst-case, and most likely scenarios to calculate an average duration. |
| Bottom-Up | Breaking down tasks into smaller sub-tasks and estimating durations for each, then aggregating them. |
Gantt Chart Software & Tools
Using dedicated software or online Gantt chart tools simplifies the process. These tools allow real-time collaboration and integrate with other project management tools.
Some popular options include:
- Microsoft Project: A comprehensive project management tool with robust Gantt chart capabilities.
- GanttPro: A user-friendly online Gantt chart software with team collaboration features.
- ProjectManager: An all-in-one project management solution with interactive Gantt charts.
- Asana: A versatile task management tool that includes Gantt chart functionality.
- Smartsheet: A spreadsheet-based platform with powerful Gantt chart features.
“Choosing the right Gantt chart software depends on your team’s specific needs, budget, and existing project management tools. Many of these platforms offer free trials or demos, allowing you to explore their features before committing.”
Creating detailed Gantt charts helps teams stay organized. It improves communication and project delivery. Following these steps and using proper software will lead to success.
Project Management Tool Options
Gantt charts can be used in conjunction with other project management tools, such as project management software, to provide a comprehensive view of the project. This enables project managers to track progress, identify potential issues, and make adjustments to the project plan as needed. Integrating Gantt charts with tools like Microsoft Project, Asana, or Smartsheet enhances their functionality, allowing for real-time updates, collaboration, and more detailed project tracking.
Project Schedule Templates
Gantt charts can be used to create project schedule templates that can be reused for similar projects. This saves time and effort, as project managers can simply modify the template to suit the needs of the new project. These templates provide a standardized approach to project planning, ensuring consistency and efficiency across multiple projects. By leveraging Gantt chart templates, project managers can streamline the planning process and focus on execution and monitoring.
By understanding and utilizing these benefits, project managers can significantly enhance their project planning and execution processes, leading to more successful project outcomes.

Advantages & Disadvantages of Using Gantt Charts
Gantt charts are vital for project management in many industries. They offer benefits like better project visualization, communication, and resource allocation. However, it’s important to understand their limitations too.
Gantt charts provide a clear visual of project schedules. They simplify complex timelines, making tasks and dependencies easier to understand. This visual approach improves project visibility and keeps everyone on track.
These charts also help with resource management. Managers can spot potential resource issues and make timely adjustments. This prevents delays and optimizes resource use.
However, Gantt charts have some drawbacks. Large projects can make charts cluttered and hard to follow. In such cases, additional tools may be needed for a full project view.
Updating Gantt charts can be time-consuming. Manual updates for complex projects may cause delays and accuracy issues. Many organizations use software like Confluence to automate updates and track changes efficiently.
| Advantages | Disadvantages |
|---|---|
| Improved project visualization | Complexity in managing large projects |
| Enhanced communication and collaboration | Need for frequent updates |
| Effective resource allocation and management | Time-consuming manual creation and updating |
| Easy progress tracking and issue identification | Potential lack of detailed task information |
Despite limitations, Gantt charts are still valuable for project management. Understanding their pros and cons helps managers use them effectively. Combined with other tools, Gantt charts can greatly aid project success across industries.
Gantt Chart Alternatives for Project Management
Gantt charts have been a project management staple for over a century. However, they’re not always the best fit for every project or team. Many project managers are exploring alternative tools for complex projects and agile methodologies.
Let’s compare Gantt charts to three popular alternatives. We’ll look at network diagrams, PERT charts, and kanban boards.
Gantt Chart vs. Network Diagram
Network diagrams focus on relationships and dependencies between tasks, not their durations. They show how tasks flow from one to another. This makes it easier to spot potential bottlenecks or critical paths.
Gantt Chart vs. PERT Chart
PERT charts are similar to network diagrams but include probability and uncertainty. They use a network format to show task dependencies. PERT charts calculate expected task times based on optimistic, pessimistic, and likely estimates.
This approach works well for projects with high uncertainty or risk.
Gantt Chart vs. Kanban Board
Kanban boards are popular in agile project management. They visually represent work in progress. Unlike Gantt charts, kanban boards focus on continuous flow and limiting ongoing work.
Tasks are cards that move across columns representing completion stages. Kanban boards suit teams with flexible workflows and changing priorities.
| Gantt Chart | Network Diagram | PERT Chart | Kanban Board |
|---|---|---|---|
| Emphasizes task durations and timelines | Focuses on task dependencies and work flow | Incorporates probability and uncertainty into task duration estimates | Visualizes work in progress and emphasizes continuous flow |
| Linear timeline format | Network diagram format | Network diagram format with probability estimates | Board with columns representing task stages |
| Best for projects with well-defined tasks and timelines | Ideal for identifying critical paths and potential bottlenecks | Useful for projects with high levels of uncertainty or risk | Optimal for agile teams with flexible workflows and changing priorities |
Choosing between a Gantt chart and an alternative depends on the project’s nature and complexity. It also depends on the project management methodology used. Understanding each option’s strengths helps managers select the best tool.
The right choice will help teams effectively plan, execute, and monitor their projects. Consider your team’s needs when selecting a project management tool.
Mastering Gantt Charts for Effective Project Management
Gantt charts are powerful tools for project management. They help define project scope and break it into manageable tasks. This visual approach improves team collaboration and keeps everyone aligned.
Accurate task durations and dependencies are crucial for Gantt chart mastery. Involve team members in estimating timeframes and identifying task relationships. This teamwork improves accuracy and fosters ownership among team members.
Regular updates to Gantt charts are vital for tracking progress. They help identify potential roadblocks early on. This proactive approach is key to effective project management and contributes to success.
“Gantt charts are not just a tool for project managers; they are a powerful communication device that can keep team members and stakeholders informed and engaged. By sharing our Gantt charts and using them as a focal point for discussions, we can ensure that everyone has a clear understanding of project objectives, timelines, and dependencies.”
Specialized Gantt chart software offers advanced features for project management. These tools include resource management, cost tracking, and collaboration capabilities. They can optimize resource allocation, monitor budgets, and enhance teamwork.
- Clearly define project scope and break it down into manageable tasks
- Ensure accurate task durations and dependencies
- Regularly update the Gantt chart to reflect project progress and changes
- Use Gantt charts to communicate with team members and stakeholders
- Leverage Gantt chart software features for resource management, cost tracking, and collaboration
Following these best practices improves project success chances. Strategic and consistent use of Gantt charts is key. They guide strong team collaboration and data-driven decisions.
| Gantt Chart Best Practice | Benefit |
|---|---|
| Clear project scope definition | Ensures accurate Gantt chart representation |
| Accurate task durations and dependencies | Creates realistic and reliable project timelines |
| Regular Gantt chart updates | Enables proactive issue identification and resolution |
| Using Gantt charts for communication | Keeps team members and stakeholders informed and engaged |
| Leveraging Gantt chart software features | Optimizes resource allocation, budget tracking, and collaboration |
Mastering Gantt charts means adopting a proactive, collaborative approach. Using the right tools and best practices unlocks their full potential. This paves the way for consistent project success.
Conclusion
Gantt charts are crucial in modern project management. They help plan, schedule, and track projects efficiently. This guide has covered their key components, history, creation, and effective use.
Project managers across industries rely on Gantt charts. They visually represent timelines, tasks, dependencies, and milestones. This aids collaboration, communication, and successful project delivery.
Gantt charts have some limitations. However, their benefits outweigh drawbacks when used correctly. They remain essential in the evolving field of project management.
“Gantt charts are not just a tool; they are a catalyst for effective project management, empowering teams to achieve their goals and deliver exceptional results.”
Key takeaways for leveraging Gantt charts include:
- Understand the fundamental components and structure of Gantt charts
- Recognize the various applications and benefits of using Gantt charts in project management
- Learn how to create and customize Gantt charts to suit your project’s unique requirements
- Utilize Gantt charts in conjunction with other project management methodologies and tools
- Continuously refine and adapt your Gantt charts as your project progresses and evolves
Mastering Gantt charts will equip you for future challenges. You’ll be able to deliver projects on time, within budget, and to high standards.
| Project Management Software | Gantt Chart Functionality |
|---|---|
| Microsoft Project | Comprehensive Gantt chart capabilities for task sequencing, resource allocation, and progress tracking |
| Smartsheet | Interactive Gantt charts that can be easily updated and shared with teams and stakeholders |
| Asana | User-friendly interface for creating Gantt charts, known as ‘Timeline view’ |
| Trello | Utilizes a plugin called ‘Big Picture’ for Gantt chart functionality, ideal for smaller, less complex projects |
| GanttPRO | Dedicated to Gantt charts, offering an intuitive interface and features tailored for chart creation and management |
Remember the power of Gantt charts in your next project. They play a vital role in planning, scheduling, and tracking. Use the insights from this guide and watch your projects thrive.
Frequently Asked Questions
What is a Gantt chart used for in project management?
Gantt charts help plan, schedule, and track projects. They break down projects into smaller tasks with clear start and end dates. These charts connect related tasks and help assign resources effectively.
How do I create a Gantt chart for my project?
First, define your project scope and break it into tasks. Decide how long each task will take and how they depend on each other. Create a timeline and assign tasks to team members.
Add important milestones and adjust the schedule as needed. Using special software or online tools can make this process easier.
What are the key components of a Gantt chart?
A Gantt chart has several key parts. The task list shows all project tasks on the left side. Task bars are horizontal lines showing how long each task takes.
Milestones mark important dates or achievements. Dependencies show how tasks connect to each other. The timeline at the top helps plot tasks and milestones.
Can Gantt charts be used in Agile project management?
Yes, Gantt charts work well with Agile project management. They give a big-picture view of the project timeline while staying flexible. These charts help teams see the whole schedule and work better together.
How do I choose the right Gantt chart software for my needs?
Look for software that’s easy to use and helps your team work together. Check if it works with other tools you use. Popular options include Microsoft Project, GanttPro, and Asana.
Think about what your project needs and how big your team is. This will help you pick the best software.
What are the benefits of using a Gantt chart in project management?
Gantt charts show the project schedule clearly, helping teams communicate better. They make it easier to assign tasks and manage resources. These charts also help track progress and spot potential problems early.
How do I update and maintain my Gantt chart throughout the project lifecycle?
Regularly check and update your Gantt chart as the project moves forward. Use software features to track completed tasks and reassign work. Keep your team and stakeholders informed about any changes.
Think of your Gantt chart as a living document that grows with your project.
Can Gantt charts be used for resource management and allocation?
Yes, Gantt charts help manage and assign resources. They show each team member’s workload, preventing over or under-use of people. Many Gantt chart programs have special features for managing resources.
How do I present my Gantt chart to stakeholders and clients?
When showing your Gantt chart, focus on the big picture. Highlight key dates and deliverables. Use clear labels and colors to make it easy to understand.
Many Gantt chart tools let you share or export your chart for better communication.
What are some alternatives to Gantt charts for project management?
Network diagrams show how tasks depend on each other. PERT charts use diagrams and guesses to estimate task times. Kanban boards show work in progress.
Choose the best tool based on your project’s type, complexity, and management style.


10 Responses
Thank you for your sharing. I am worried that I lack creative ideas. It is your article that makes me full of hope. Thank you. But, I have a question, can you help me?
Blockchain integration in business
Thank you for your sharing. I am worried that I lack creative ideas. It is your article that makes me full of hope. Thank you. But, I have a question, can you help me?
Ethereum news
I don’t think the title of your article matches the content lol. Just kidding, mainly because I had some doubts after reading the article.
Your point of view caught my eye and was very interesting. Thanks. I have a question for you.
For over a decade, Schwarzenegger has condemned all athletic
and beauty steroid use. As the pinnacle of the President’s Council on Physical Health under George Bush
the elder, he urged kids to stay off steroids and as a substitute rely on exhausting work to
succeed in their athletic targets. And according to Schwarzenegger’s
personal Net site, his Arnold Basic bodybuilding competitors was the primary of its sort to require drug testing.
Stats show an enormous downside, with up to 1 million UK men presumably utilizing steroids
final 12 months. This may make best injectable steroids
(Gilberto) the second-most widespread illegal drug there, after weed.
Latest knowledge reveals almost 7% of teenage boys in Minnesota have
used them too.
“All Over The Place I go, individuals ask me when I’m going to do another massive action comedy like ‘True Lies,'” he informed Netflix’s
Tudum. “Nicely, here it is.” He additionally promised that fans who’d
enjoyed his film work would respect “FUBAR” even more —
and even longer. “‘FUBAR’ will kick your ass and make you laugh — and never just for two hours,” he added.
Extra than just persevering with his roles in action motion pictures, Schwarzenegger went from a politician to
a TV star to fill the function of a TV star-turned-politician.
In 2015, Schwarzenegger became the face of the “Celebrity Apprentice,” replacing Donald Trump, who had determined to
run for president.
Arnold’s recommendation to young athletes is to learn about steroids and select health over simply getting massive muscle tissue.
Steroids can mess up your hormones, damage your liver, and
harm your coronary heart. The Mayo Clinic says these drugs,
like faux testosterone, trigger issues corresponding to hypertension and liver tumors4.
Schwarzenegger mentions how steroid abuse may even result in needing
a model new kidney4. He suggests that an enormous a half of
his own bodybuilding success was due to steroids5, showing the robust reality of steroid use.
Testosterone substitute remedy (TRT) is a popular remedy athletes use for muscle upkeep, energy, and quite a lot of different advantages that
aid low testosterone. From powerlifting sensation Larry Wheels
to Jay Cutler, TRT continues to have a major impact on athletes’
well being in 2023. ‘The Blond Myth’ Lee Priest discussed the
topic once and mentioned Dianabol was Schwarzenegger’s favourite compound.
Priest explained that occasions were different back when Schwarzenegger would compete
and mentioned athletes didn’t have ‘set rules’ about steroid protocols.
Following years of hypothesis, Schwarzenegger has shared his Olympia-winning cycle, which consisted of Dianabol and testosterone.
Schwarzenegger managed to say a total of seven Mr.
Olympia titles just shy of the joint record set years later by eight-time winners Lee Haney
and Ronnie Coleman.
Appearing on “The Tonight Present with Jay Leno,” Arnold
Schwarzenegger announced he planned to run for the governorship
of California. This got here because of the 2003
recall of California’s governor Grey Davis — the first governor recall
election in the state’s history. The data that we’ve
about this dictates that Arnold used 15-20mg of Dianabol every single
day with one hundred mg of Primobolan per week.
Nevertheless, controversy persists, particularly
around the misconception that steroids alone can build muscle
tissue without figuring out. Shortly before putting
the rat inside the chamber, D’Agostino had injected a new, one-of-a-kind
molecule down the animal’s throat. Department of Defense’s Office of Naval Research, and this experiment, which
he carried out in mid-2011, was his first take a look at
of whether the brand new molecule may help a rat withstand an onslaught of oxygen.
Nevertheless, as “Joining Arnold” famous, he did not go to either of their funerals.
Whereas in South Africa in 1972, he injured himself training for the Mr.
Olympia competition. “I came back from that knee damage and my thighs have been greater and better and extra minimize in 1973 at the Olympia and I received the Mr. Olympia,” Schwarzenegger recalled on “The Tim Ferriss Present.”
Right Now, the fitness world goals to construct muscle in safer methods.
They choose steroid alternatives for more healthy and sustainable growth.
The use of anabolic steroids has greatly changed bodybuilding aesthetics over time.
Icons like Arnold Schwarzenegger formed the “golden period,” but today, steroids define top bodybuilders.
Schwarzenegger often talks concerning the risks of abusing steroids.
He mentions severe points like hypertension and coronary heart
issues.
Athletes had to depend on rumors to learn in regards to the results of those
drugs. However issues began to alter as more individuals began to speak brazenly about utilizing steroids.
Arnold determined to ask his doctor for a prescription, stepping into the
world of steroids. Even though he used steroids before, Schwarzenegger identified he
did so beneath a physician’s watch. He warned about
the risks of steroids, mentioning the well being risks they bring.
These doses may be 10 to a hundred times higher than doses prescribed
by medical professionals to deal with medical conditions.
Some bodybuilders and athletes typically take two or more
anabolic steroids on the identical time in a cyclic
manner often known as “cycles” lasting from a few weeks
to a few months, believing that it will enhance their effectiveness and reduce the unwanted effects 21,
22, 23, 12. All anabolic steroids are Drug Enforcement Administration (DEA) schedule three medicine 24, 25, 26.
Utilizing anabolic steroids this way, with no prescription from
a doctor, isn’t legal or secure.
The dose-response curve for anabolic steroids has not been clearly defined,
but male athletes and physique builders usually use mega dosages 28.
They also usually use quite so much of anabolic steroids concurrently (“stacking”) or sequentially (“cyclically”) due to
a belief that these regimens are safer 28.
With the exception of a few elite female athletes
and body builders, ladies seldom use supraphysiologic dosages of anabolic
steroid.
One Other chaperone referred to as p23 stabilizes the
aporeceptor complicated by blocking Hsp90 in the ATP-bound substrate conformation. Co-chaperones using tetratricopeptide repeat motifs are necessary for docking of the Hsp90.
As an adjunct, other chaperones, called Hsp40 and Hsp70 and an organizing
protein called Hop (heat-shock organizing protein) are important in the meeting of the steroid receptor–Hsp90
complex. Picard (2006) provides a transparent overview of molecular chaperones and cofactors which are relevant to steroid receptor motion. Phosphorylation of the receptors
is also important in regulation of receptor function (Weigel and Moore, 2007).
One purpose for this might be that the low intratesticular testosterone levels derived
from the circulation proceed to stimulate spermatogenesis in some males (180).
In the HAARLEM examine, practically all subjects had undetectable LH and FSH ranges during AAS use.
Nonetheless, solely two-thirds of topics have
been azoo- or oligozoospermic on the finish of their cycle (176).
Anadrol, identified scientifically as Oxymetholone, stands as a powerful
anabolic steroid that instructions respect and consciousness in bodybuilding and athletic circuits.
Anadrol’s main accolades stem from its potent ability to facilitate speedy muscle development and
improve energy, a cornerstone for bodybuilders and athletes trying to elevate their
performance decisively. When used responsibly and
with skilled steering, Anadrol can considerably reduce fatigue, permitting for extra rigorous and productive exercises that push performance boundaries.
Its advantages lengthen to selling important features
in muscle mass, often making it the bulking agent of choice for those committed to attaining peak
physical prowess. Primobolan, scientifically known as Methenolone,
is an injectable steroid that possesses unique properties on the planet of anabolic steroids.
First, Primobolan displays low androgenic effects and high anabolic qualities, making
it a most popular alternative for these seeking quality muscle positive aspects and preservation throughout cutting cycles.
It stands out for its capability to promote muscle retention without extreme water retention,
which is crucial for attaining a lean and outlined physique.
This is because these anabolic steroids will exhibit no Estrogenic
activity within the physique, thereby avoiding unwanted effects similar to bloating and water retention, gynecomastia, and different Estrogen-related side effects.
DHT derivatives and analogues are subsequently preferred
among bodybuilders for fats loss and cutting
phases of dieting, the place a lean and ‘hard’ look to the
physique is desired over the delicate, puffy, and bloated look that aromatizable androgens will generally provide.
An undetermined proportion of anabolic steroid users could
develop a anabolic steroid use disorder. Anabolic steroid customers additionally
may surrender different important actions for fear that they will
miss exercises, violate their dietary restrictions, or be prevented from using anabolic steroids.
Anabolic steroid users additionally typically spend large quantities of time and money obtaining the medication, they usually may attempt to reduce or
stop anabolic steroid use with out success—possibly because of depression, anxiety about losing muscle mass, or and different disagreeable
effects of withdrawal forty two. As an adjunct, a lot of the physiological
significance of non-genomic actions of androgens is still
to be elucidated, not least with respect to androgen-induced cell-cycle progression.
The induction of second messenger sign transduction cascades by steroids commonly happens inside seconds to a
couple minutes, in distinction to genomic activity of the classic steroid receptors that takes 30–60 min.
Most binding research, however, indicate that anabolic steroids have very
low binding affinity for the glucocorticoid receptor (Hickson et al., 1990),
a notable exception being THG, which binds with high affinity (Friedel et al., 2006b).
An various speculation, due to this fact, is that anabolic steroids may intrude with glucocorticoid receptor expression at the gene degree.
Eisenberg and Gordan (1950) proposed using the rat levator
ani muscle as a bioassay of protein anabolic activity; the anatomical
drawings from the dissection of the male rat, displaying the location of this
muscle, the prostate and seminal vesicles are displayed in this paper.
The rat levator ani muscle is part of the perineal complex of
striated muscular tissues that envelope the rectum.
Primobolan has lengthy been popular amongst athletes
because it might possibly construct power without muscle bulk
or many of the adverse side effects of other steroids. Steroids
are organic compounds that hold a chemical structure characterized by
a selected arrangement of four cycloalkane rings that are connected to a minimal of one another.
These rings are composed of no much less than twenty carbon atoms which are certain collectively, which type the ring shapes.
The A, B, and C rings are cycloalkane rings known particularly as cyclohexane rings (rings that contain 6 carbon atoms).
The D ring differs from the other rings because of the fact that it is identified as
a cyclopentane ring (a ring that contains 5 carbon atoms).
The above testosterone cycle could be classified as a bulking one, with users experiencing large increases in muscular energy
and hypertrophy.
Nonetheless, by means of pure muscle acquire, we rank trenbolone among the many
best steroids to bulk up (soshgic.edu.gh) bulking steroids.
Trenbolone is a very highly effective injectable steroid that produces giant increases in lean muscle.
Due to a lack of aromatization, it does not cause
any noticeable water retention, making general weight gain lower than on Dianabol or Anadrol.
We have seen Testo-Max stacked with numerous different legal steroids from
Loopy Bulk and produce good results. Sustanon 250 is
an effective testosterone ester used in bulking cycles to add significant quantities of muscle and
power.
This can ease signs of inflammatory conditions, similar to rheumatoid arthritis, inflammatory bowel illness (IBD), asthma, allergic reactions and
skin rashes. This might help management conditions during which the immune
system mistakenly attacks its personal tissues. Sure, if you take prescription anabolic steroids beneath
the supervision of your healthcare supplier for
a medical purpose, anabolic steroids are typically secure.